Data Visualisation
Data Summary
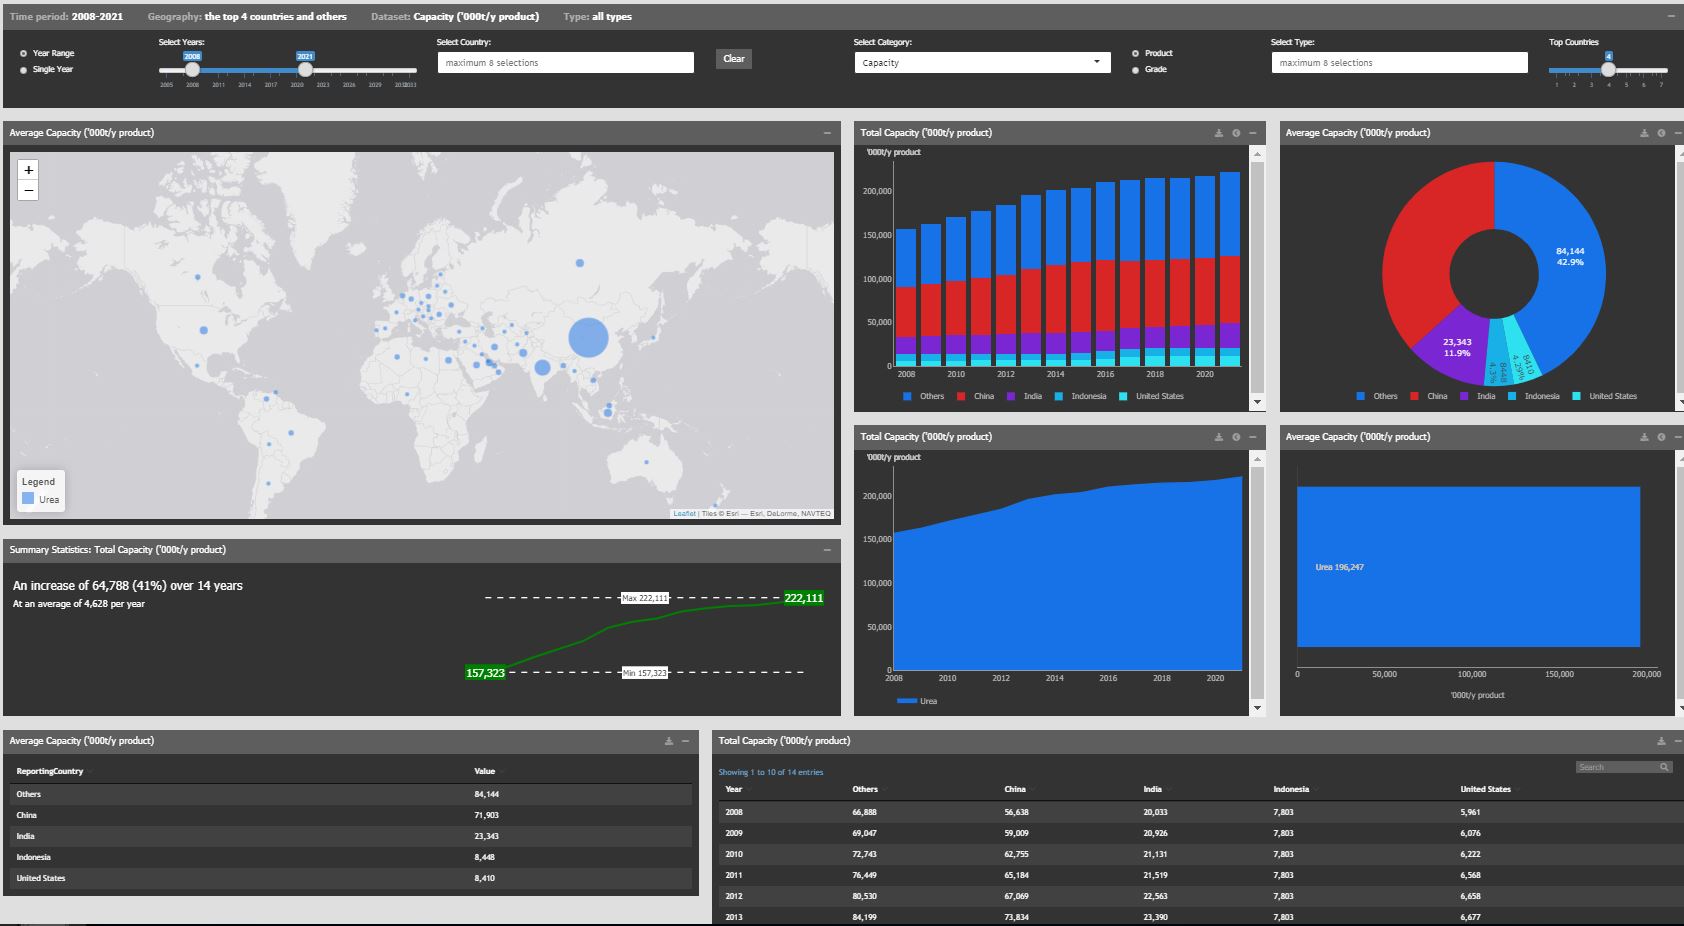
A great dashboard offering a valuable snapshot across various selection criteria
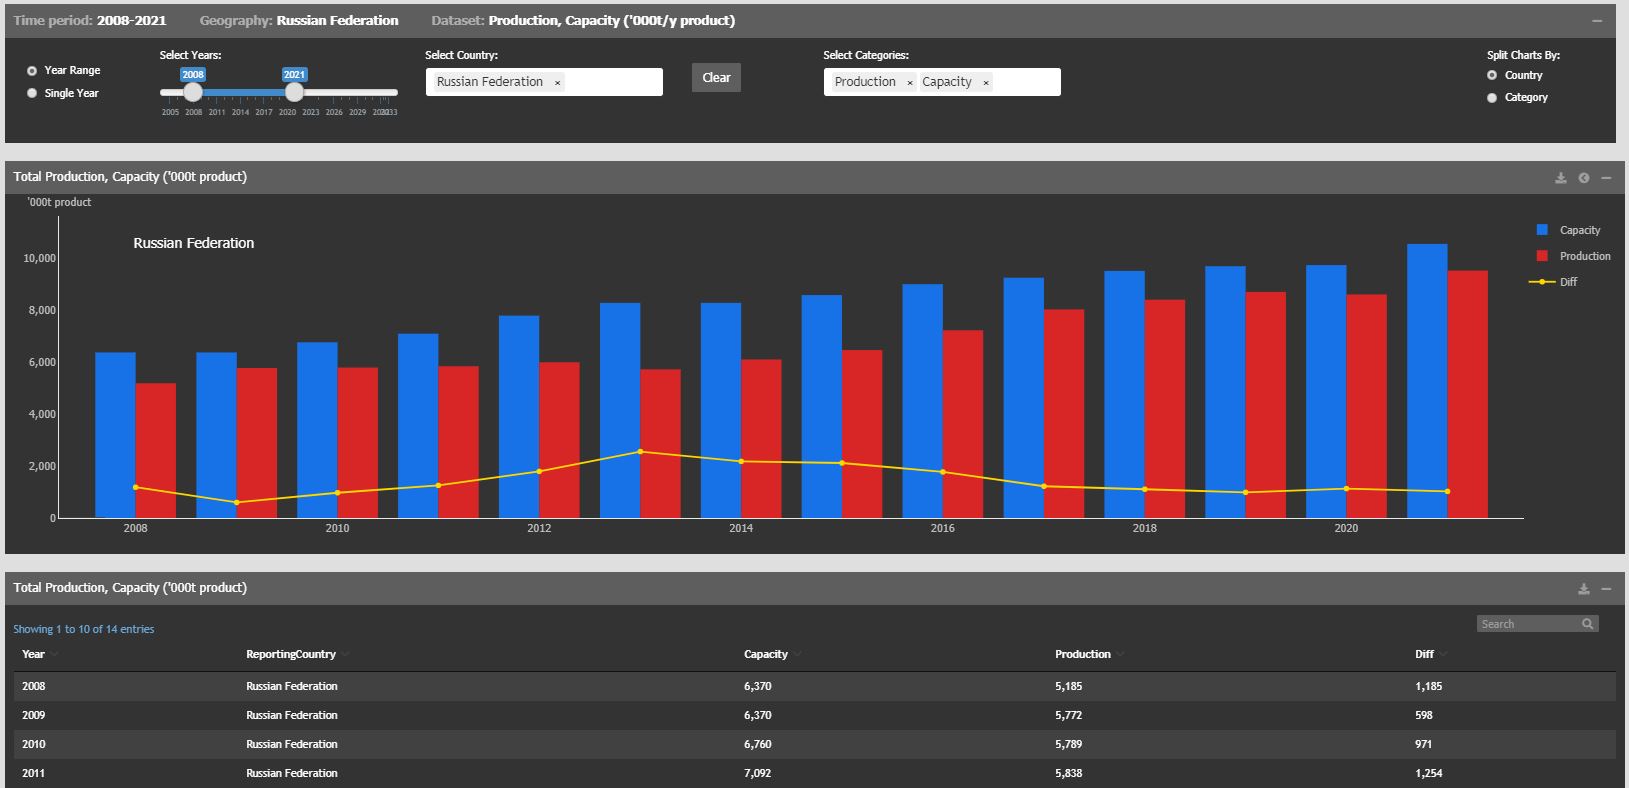
Advanced Chart builder
Time period: Year Range or Single Year
Country (up to 8 can be compared)
Categories: Capacity, Consumption, Production, Trade (annual imports or exports), Stocks
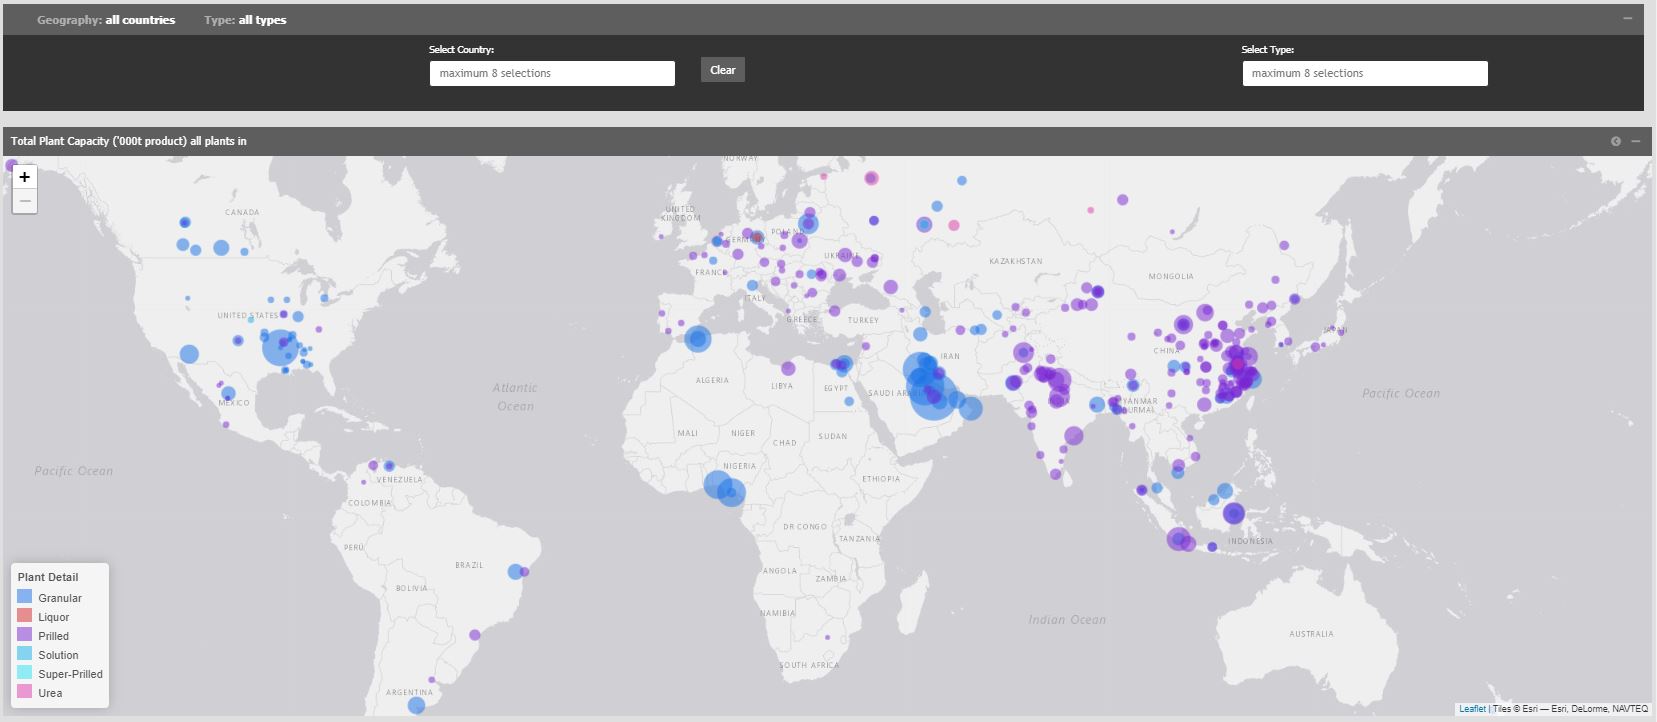
Capacity by plant
Valuable map and data table view of capacity at country level, including plant detail, company, status, max capacity and more
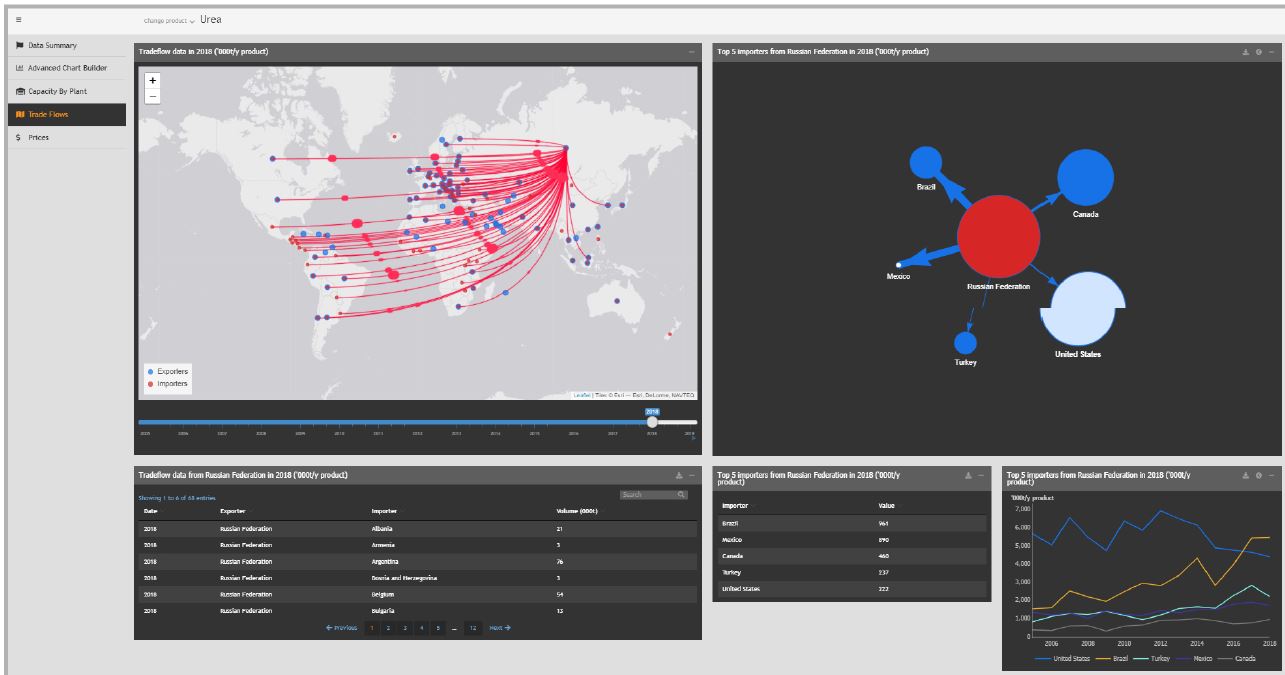
Trade flows
Build out an animated trade flow map at country level, selecting by year, month, exporter or importer.
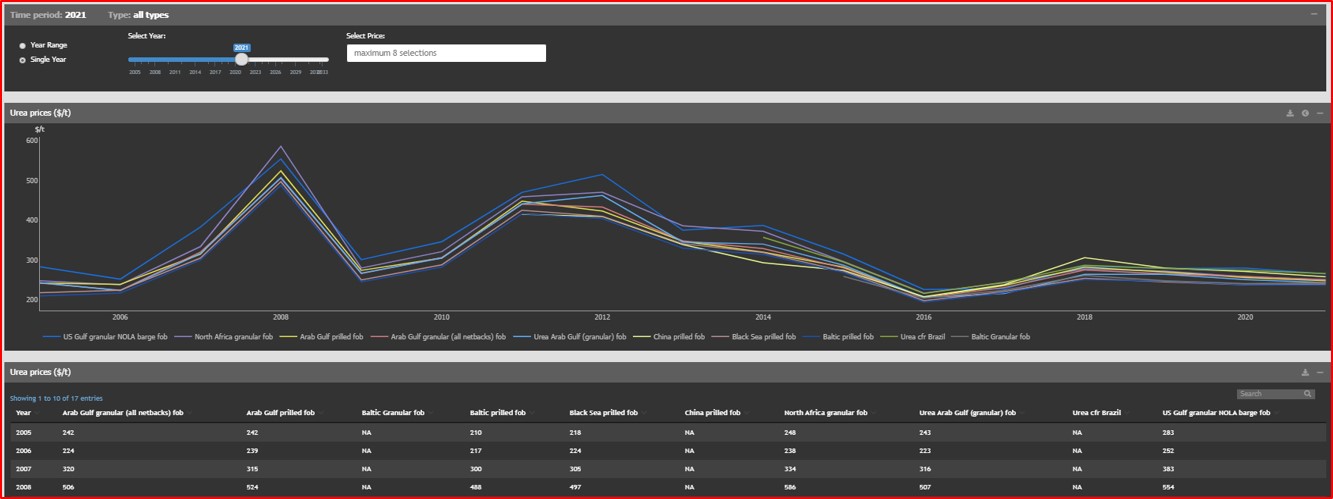
Prices
View historical and forecast prices by year or year range, across product types.
