India’s December coal receipts slow
09 Jan 19, 18:24 - Coal, Steam coal, Fundamentals, Demand
London, 9 January (Argus) — API 2 calendar 2020 has started its stint as the new year-ahead coal contract weaker than its predecessor for the first time since 2016, with upward market momentum slowing after nearly three years of price increases.
Argus' first year-ahead API 2 assessment of 2019 was down by $4/t on the year, at $82.15/t, and has since slipped to as low as $78.95/t. In January 2016-18, the benchmark API 2 swap started at $40.80/t, $61.20/t and $86.15/t, respectively.
Europe decouples from Asia-Pacific
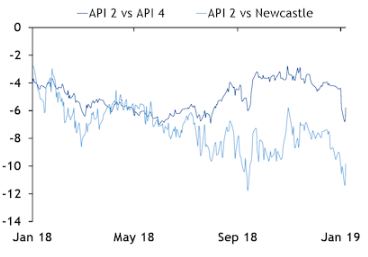
Chinese import restrictions and concern about a possible economic slowdown in China have raised questions about seaborne coal demand from the world's biggest importer in 2019. But while this might have cooled sentiment across global markets, in Europe — where buyers do not compete for the Indonesian and Australian coal that dominates China's import mix — prices have fallen more steeply in response to mild weather, full stocks and increasing competition from gas.
Argus' cif Amsterdam-Rotterdam-Antwerp (ARA) daily price assessment has fallen by over $10/t in the past three weeks, and the calendar 2020 API 2 swap has shed around $7/t. The European physical spot market and forward paper prices have both opened up sizeable discounts to equivalent NAR 6,000 kcal/kg grades in South Africa and Australia, which have been markedly less soft in recent weeks.
And Australian spot NAR 5,500 kcal/kg coal — shipped in large volumes to China, and thus sensitive to China's demand outlook — has gained value since mid-December. China recently tendered for coal imports and market sources say utilities awarded February cargoes to Indonesian suppliers, although demand could slow next month ahead of the lunar new year holidays.
The global coal market remains susceptible to policy and fundamental shifts in China, but weakness in Europe at the start of 2019 has been compounded, if not driven outright, by local supply-demand forces. In the spot market, mild weather and a large stock overhang have weighed on prices, resulting in an unusually flat shape to the 1Q-4Q near curve, compared with the steep backwardation in January 2016-18.
More competition from gas
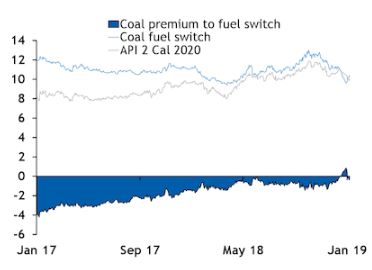
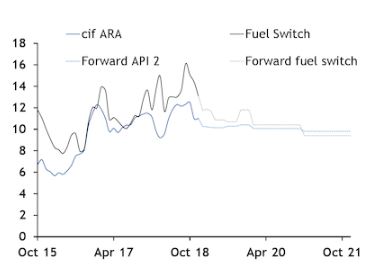
Further out, the threat of coal-to-gas fuel switching in 2020 and beyond has probably driven the market lower to keep coal narrowly competitive for power generation. For the first time in years, the API 2 year-ahead started January above the fuel-switch level at which 55pc-efficient gas-fired plants can compete with 40pc-efficient coal-fired units for base-load generation. The period from 21 December to 3 January was also the first time API 2 calendar 2020 had breached this fuel-switch threshold, but losses have since helped coal regain a narrow price advantage.
In contrast to periods over summer 2018, when fundamental tightness in the gas market supported prices at levels to keep gas uncompetitive for power generation, a more comfortable outlook for gas might now pose downside risk to the coal market in 2019.
On the spot market, German winter gas stocks remain above the recent seasonal average as a result of firm LNG supply to Europe and mild weather in the fourth quarter. High stocks and the steady stream of LNG continuing in early 2019 means Europe is better prepared than it was 12 months ago for weather-driven demand shocks in the second half of winter.
And a raft of new global LNG export projects scheduled on line could ease supply fundamentals further as the year progresses, creating increasingly significant downside risk to coal prices, although much will depend on winter temperatures in Europe and Asian LNG demand over the summer.
Up to 44mn t/yr of new LNG export capacity could launch by the end of 2019, according to Argus calculations, driving the total up by around 10pc from the 405.6mn t/yr currently operational. More than 40mn t/yr of LNG export capacity came on line in 2018, and this should also boost supply in 2019.
Most new projects are in the US and relatively close to Europe, so exports to Europe — attractive to LNG sellers as a last resort because of the continent's developed gas markets and underutilised gas-fired generation capacity — could rise if there is not a sufficiently strong price signal from Asia to draw supply away from the Atlantic.
If Europe does begin to play a role in absorbing a glut of LNG from the global market, it would be to the detriment of coal, which would need to be displaced from the generation mix in order to accommodate greater gas burn.
Atlantic gas fundamentals might therefore grow in significance for the European coal market and could spur periods of intense price competition between the fuels this year. This was not the case in 2018, as cold weather in the first quarter weighed heavily on gas stocks and supported summer demand for replenishment, while LNG supply was scarce at times in Europe as Asian demand soared.
The European gas stocks situation looks more comfortable this year, but Asian demand could remain firm. This latter point is contingent on China, which is trying to encourage gas use domestically, as greater nuclear availability in Japan and South Korea could erode gas demand elsewhere in northeast Asia, especially while coal continues to command a price advantage for power generation.
And competition from gas is only likely to increase, with forward API 2 contracts delivering in 2021 already above 40pc coal-55pc gas switching levels. The potential for further gains in carbon prices — and an improving gas supply outlook — could also threaten coal's position in the generation mix.
Further price weakness in Europe this year could make the continent less viable as a destination for coal suppliers, particularly if Asia-Pacific prices are less soft and build large premiums to Europe.
The US would probably be one supplier particularly sensitive to any downturn in European prices. When coal prices collapsed early in 2016, US exports to Europe fell to around 8mn t in the full 12-month period, down by 5mn t on 2015, but have recovered in tandem with European prices and might have topped 14mn t in 2018, which would be a four-year high.
US exports' exposure to European pricing and demand makes forecasting supply from North America difficult. The US EIA and Paris-headquartered IEA have adopted contrasting views about the level of total US exports of thermal coal, with the former forecasting a 6.7pc decline to less than 46mn t in 2019 and the latter expecting annual growth of 2.2pc over 2017-23 as a result of weaker domestic demand.
Near-term support?
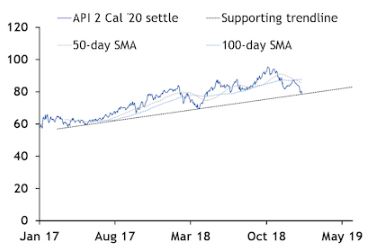
While the API 2 year-ahead has shed over $3/t in the first five sessions of 2019, an outlook for colder weather and some technical support could arrest the decline. Calendar 2020 recorded only its third daily increase in the past three weeks and its biggest gain since 26 November on 8 January, buoyed by a long-term supporting trend that has held since March 2017.
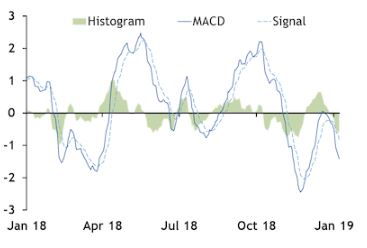
But the moving average convergence/divergence (MACD) momentum indicator continues to paint a weak picture for coal swaps, having trended below zero since early November and fallen below the signal line at the end of 2018.
This week, forecasts for Europe have pointed to colder weather for the end of January, which could tighten spot fundamentals and support the paper curve. Berlin looked poised for an unseasonably mild January earlier this month, but Speedwell now forecasts below-average temperatures from 27 January to early February.
API liquidity dips in 2018
A total of 1.3bn t of API 2 swaps trade was handled by the Ice and CME exchanges in 2018, bourse data show, down from 1.5bn t in 2017. Ice exchange-executed trade accounted for 523mn t, broker-cleared volumes on the same platform totalled 489mn t and CME trade hit 274mn t.
Average volatility — measured on a rolling 20-day basis — fell by 1.6 percentage points to 21.3pc on the year-ahead contract in 2018, and this might have reduced liquidity. The months when liquidity did gain on the year — February, April and November — all saw greater volatility on the year-ahead swap.
API 2 trade peaked in November at over 149mn t, driven by counterparties adjusting positions in futures and options ahead of the expiry of the liquid year-ahead contract.
| API 2 cal 2020 vs global markers $/t | API 2 vs German coal-gas fuel switch (40:55) €/MWh |
 |
 |
| API 2 cal 2020 $/t | API 2 cal 2020 MACD |
 |
 |
| German coal-gas fuel switch (40:55) €/MWh | |
 |
|
ARGUS Coal Daily International
Your source of International price assessments featuring prices such as cfr South China, fob Newcastle and more. |
|
|
ARGUS Coalindo Indonesian Coal Index Service
The leading coal price reference used by traders of Indonesian coal featuring price indexes ICI1, ICI2, ICI3, ICI4 and ICI5.
|
|
|
ARGUS McCloskey's Coal Price Index Service
Used by professionals globally, with more than 90pc of the world’s traded coal derivatives using the API 2 and API 4 indexes.
|